

The Vertical Report 2026 — Preview
Euclid's annual analysis of 4K+ financings, 250+ exits, and the major trends in Vertical AI
This is a preview of The Vertical Report. To get the full version, subscribe below.
Existing subscribers — it’s already in your inbox.
2025 was the year Vertical AI moved from hypothesis to reality. After a 2024 defined by AI infrastructure buildout and foundation model wars, capital flowed decisively toward industry-specific use cases. We spent months dissecting every software and AI venture deal of $1M+ across the US and Canada — 4,395 financings and 254 exits, analyzed by vertical, stage, investor, geography, and more — to understand exactly what happened, and what it means for 2026.
Here are a few of our most interesting findings, in brief:
The Year in Numbers
The US and Canadian VC market produced 4,395 software and AI financings totaling $186B in 2025. Vertical startups captured 53% of deal volume and 30% of capital deployed—though that capital gap is almost entirely a function of a small handful of infrastructure mega-rounds (OpenAI’s $40B, Anthropic’s $13B, and a few others). Strip out just the 12 deals sized $1B+ and vertical takes 51% of capital.
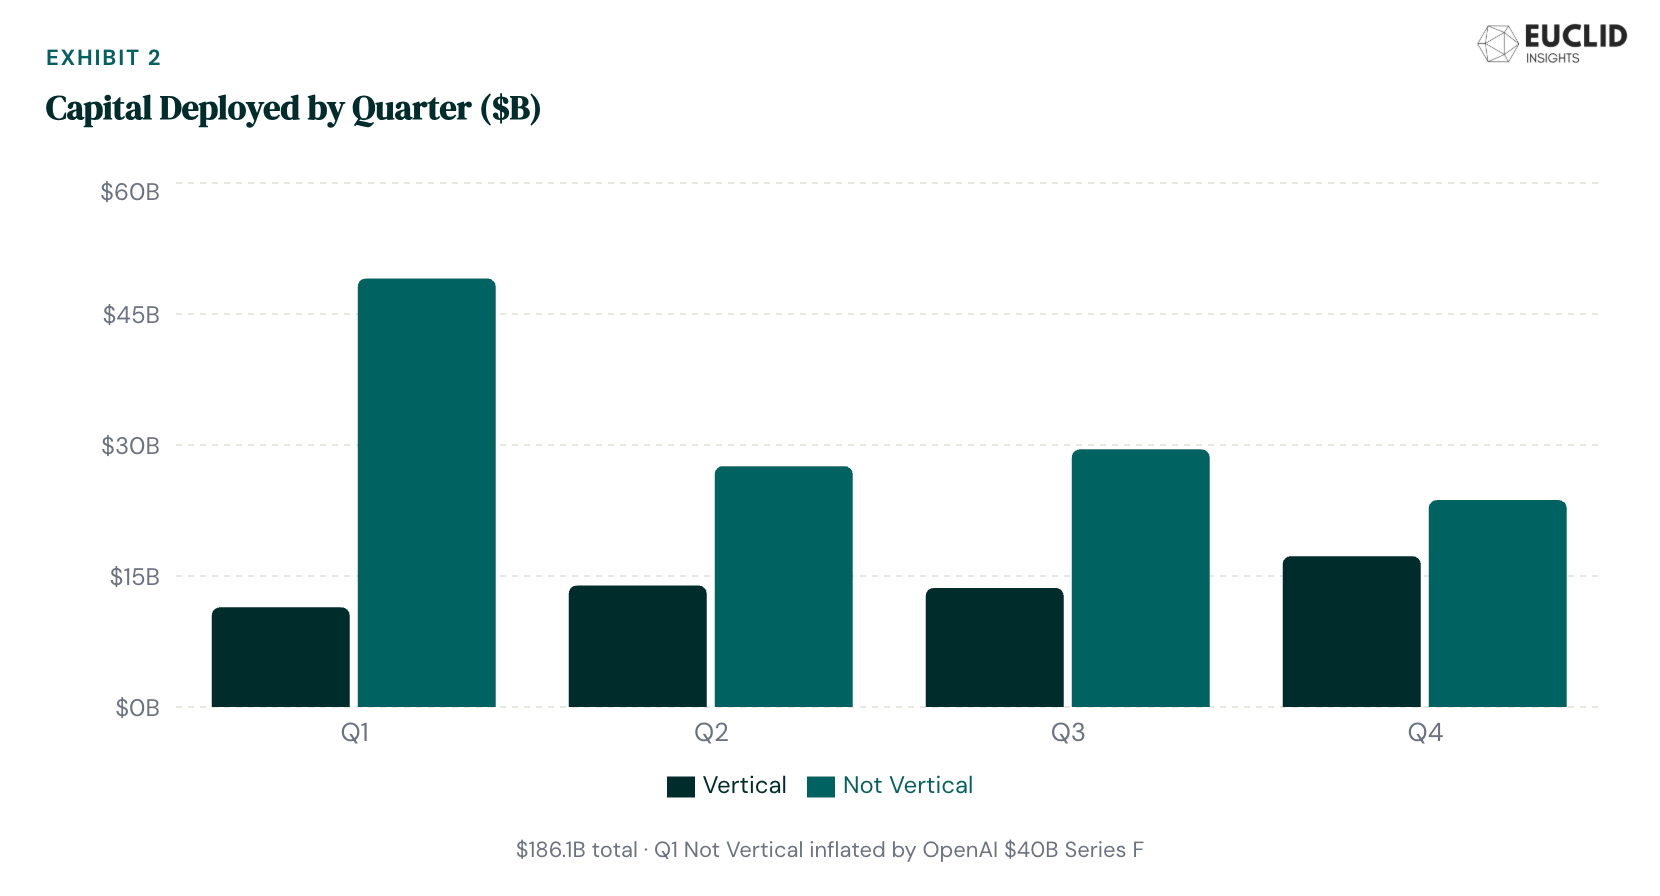
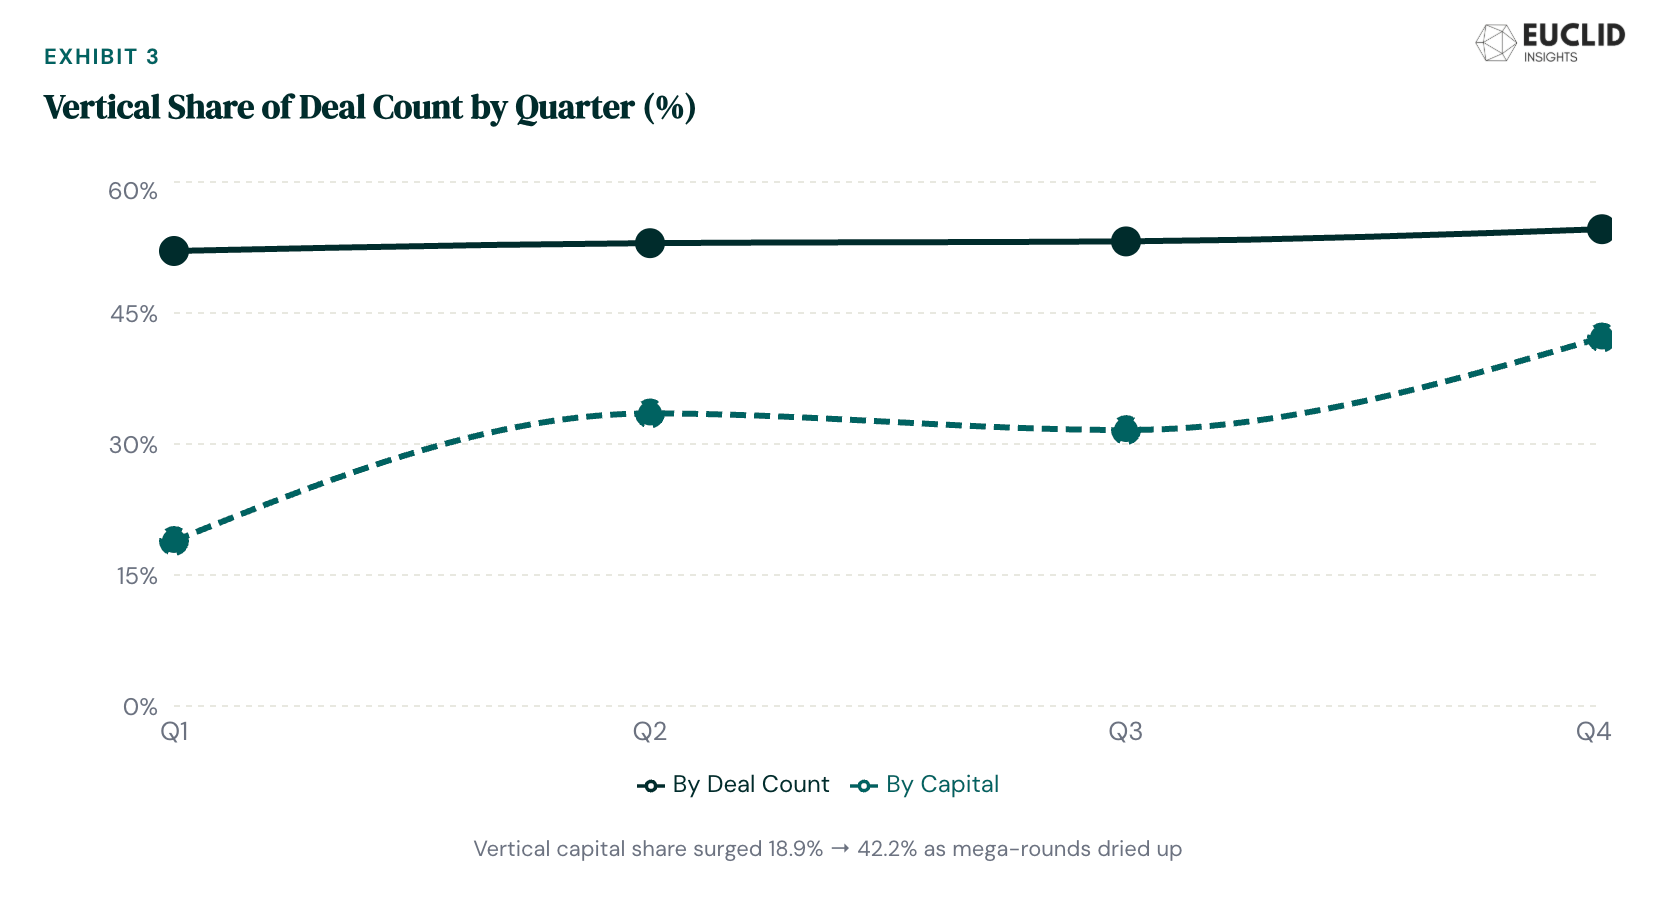
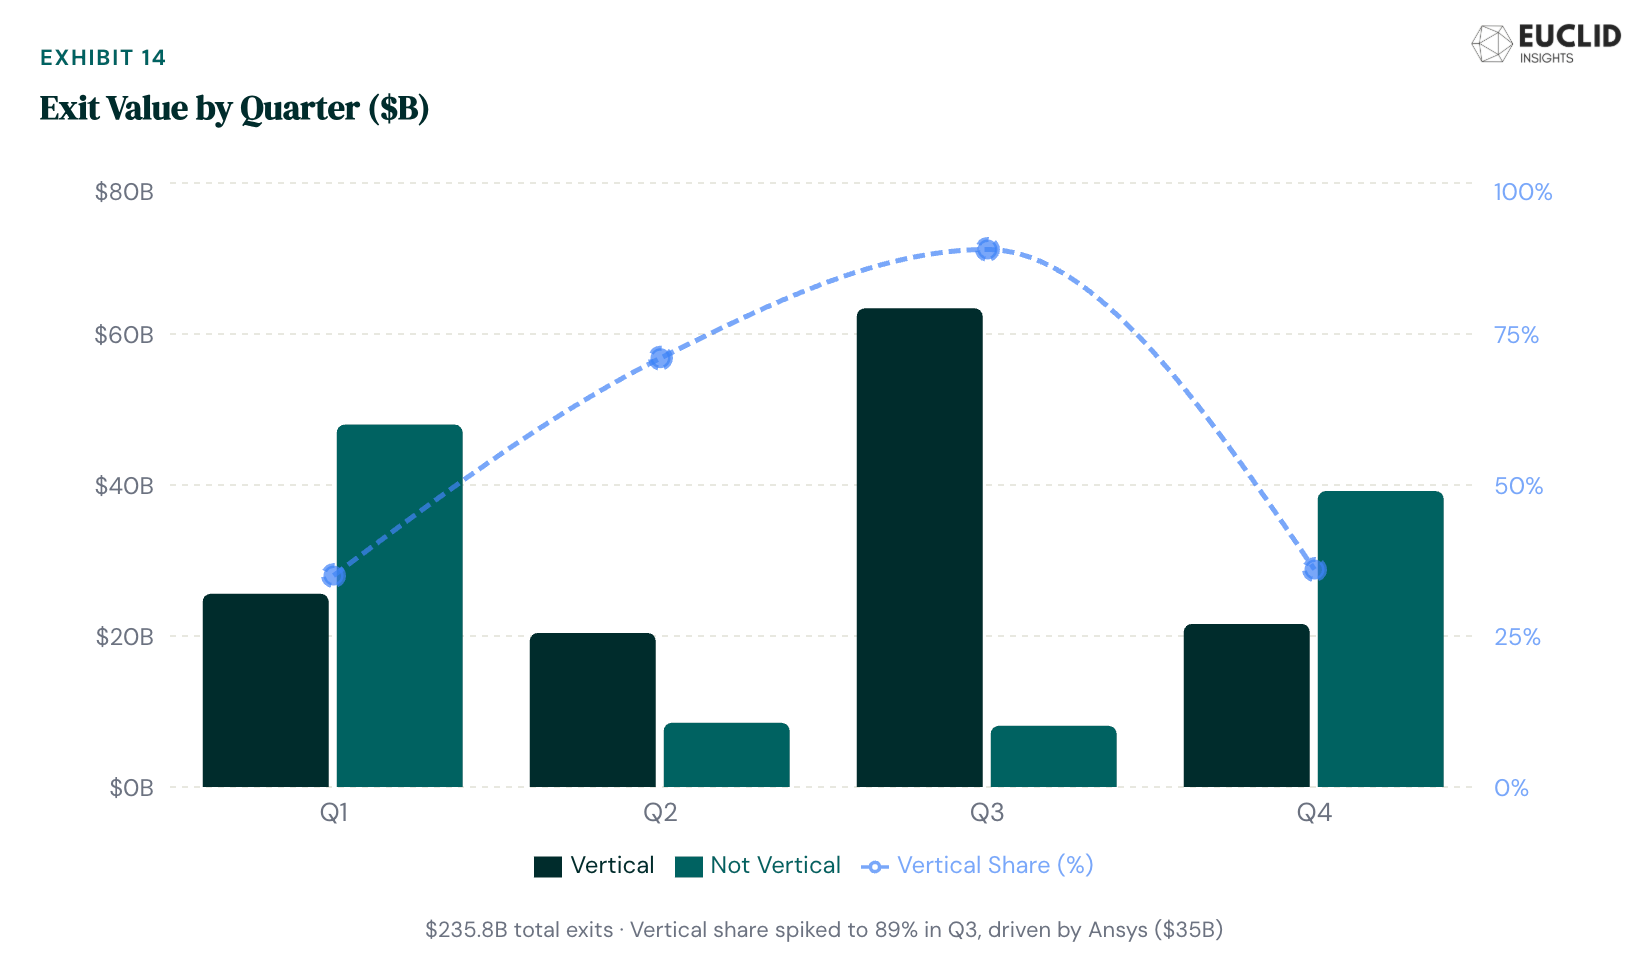
Deal volume was relatively even across quarters—Q1 and Q2 combined for 52% of the year’s deals—but capital deployment was lumpy. Q1’s $60.5B was inflated by OpenAI’s Series F alone; remove it and the quarter drops to roughly $20B, making the real quarterly trajectory far more balanced. Vertical’s share of capital climbed steadily: 19% in Q1, 34% in Q2, 32% in Q3, and 42% in Q4.
On the exit side, 2025 delivered $132.7B across 158 vertical transactions—plus another $102B in non-vertical exits. M&A dominated by count, but the story is more nuanced than that, as we’ll get to below. Healthcare led exit volume with 43 transactions, and the IPO window cracked open with 18 vertical offerings after a two-year drought.
Our full report covers vertical-by-vertical breakdowns, stage dynamics, investor league tables, geographic distribution, profiles of fifteen notable deals, and our 2026 outlook. What follows are five findings from the data that we think reframe the conventional wisdom and set the stage for another banner year in Vertical AI.
1. The Remarkable Consistency of Mega-Deals
Most people assume late-stage venture is the volatile tier—big rounds, big markdowns, boom-bust cycles. In 2025, the opposite was true.
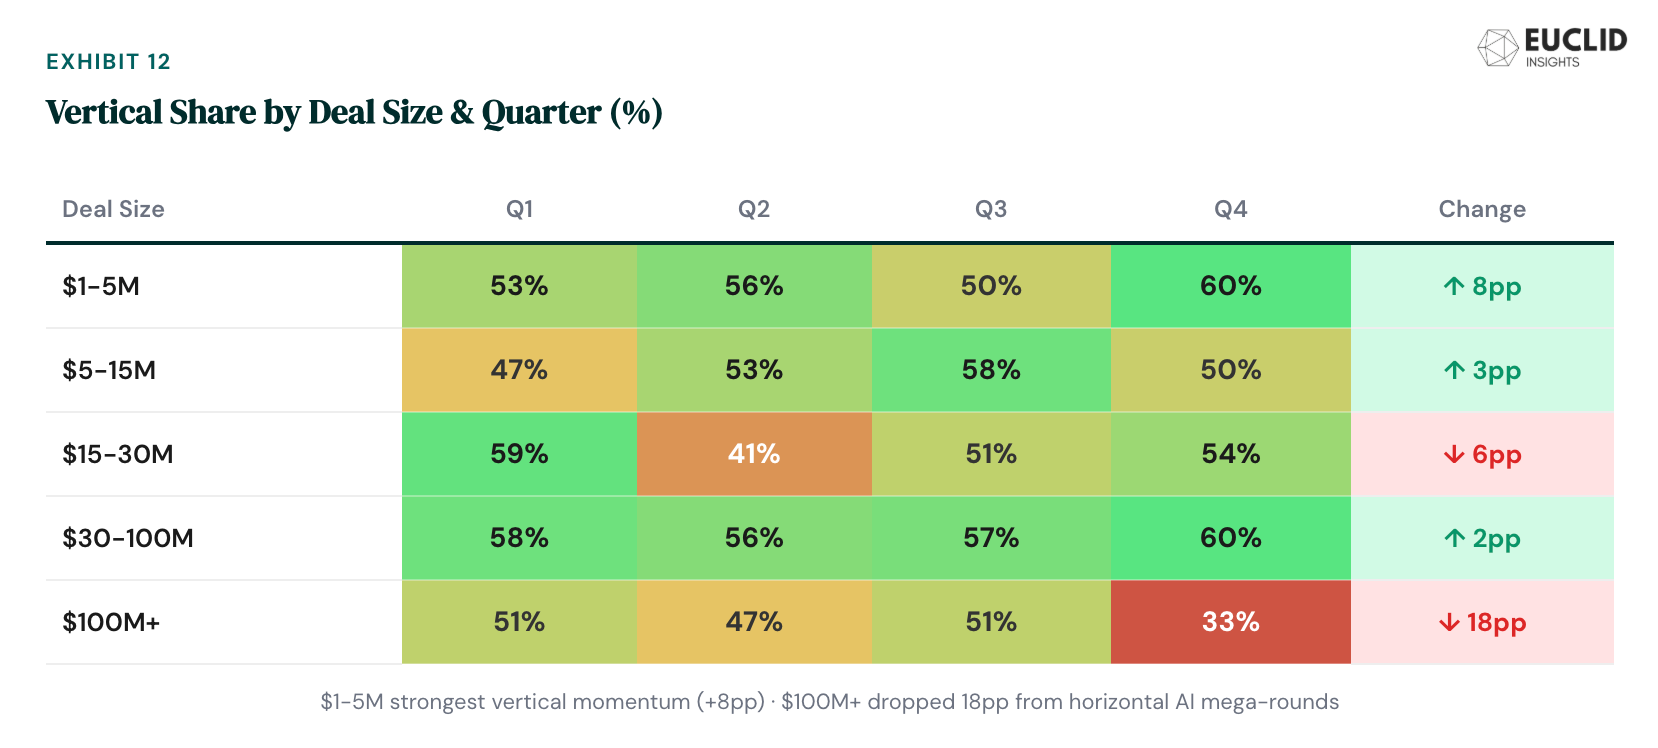
The $100M+ tier of vertical financings was the most stable bucket all year. Since Q1, we saw 55-57 deals every quarter. Meanwhile, the $1–5M tier of deals — pre-seed and early seed—dropped from 503 deals in Q1 to 362 in Q4, a 28% decline. The bottom of the market pulled back far more than the top.
Who’s sustaining that stability at the top? The investor data tells the story. The mega-round tier ($100M+) was anchored by a small group of multi-deal leads: NEA (10 leads), Kleiner Perkins (7), Oak HC/FT (5), B Capital (5), DST Global (4), and Ribbit (3). Their average deal sizes clustered tightly in the $110–180M range.
Beyond the frequent flyers, the mega-deal lead base broadened: BlackRock co-led Applied Intuition’s $600M round, Franklin Templeton led Plaid’s $575M, Qatar Investment Authority and Mubadala showed up in multiple rounds. Asset managers in pre-IPO rounds is reminiscent of 2021 — the uptick of sovereign wealth involvement is perhaps more notable, especially in light of their parallel growing interest in backing US VC funds as LPs.
2. A&D Momentum: Conviction in Chaos
When people think “hot vertical AI categories,” they think healthcare and fintech — and of course, they’d be right (especially regarding the former). But the 2025 data tells us that another category may be dominating the hype cycle.
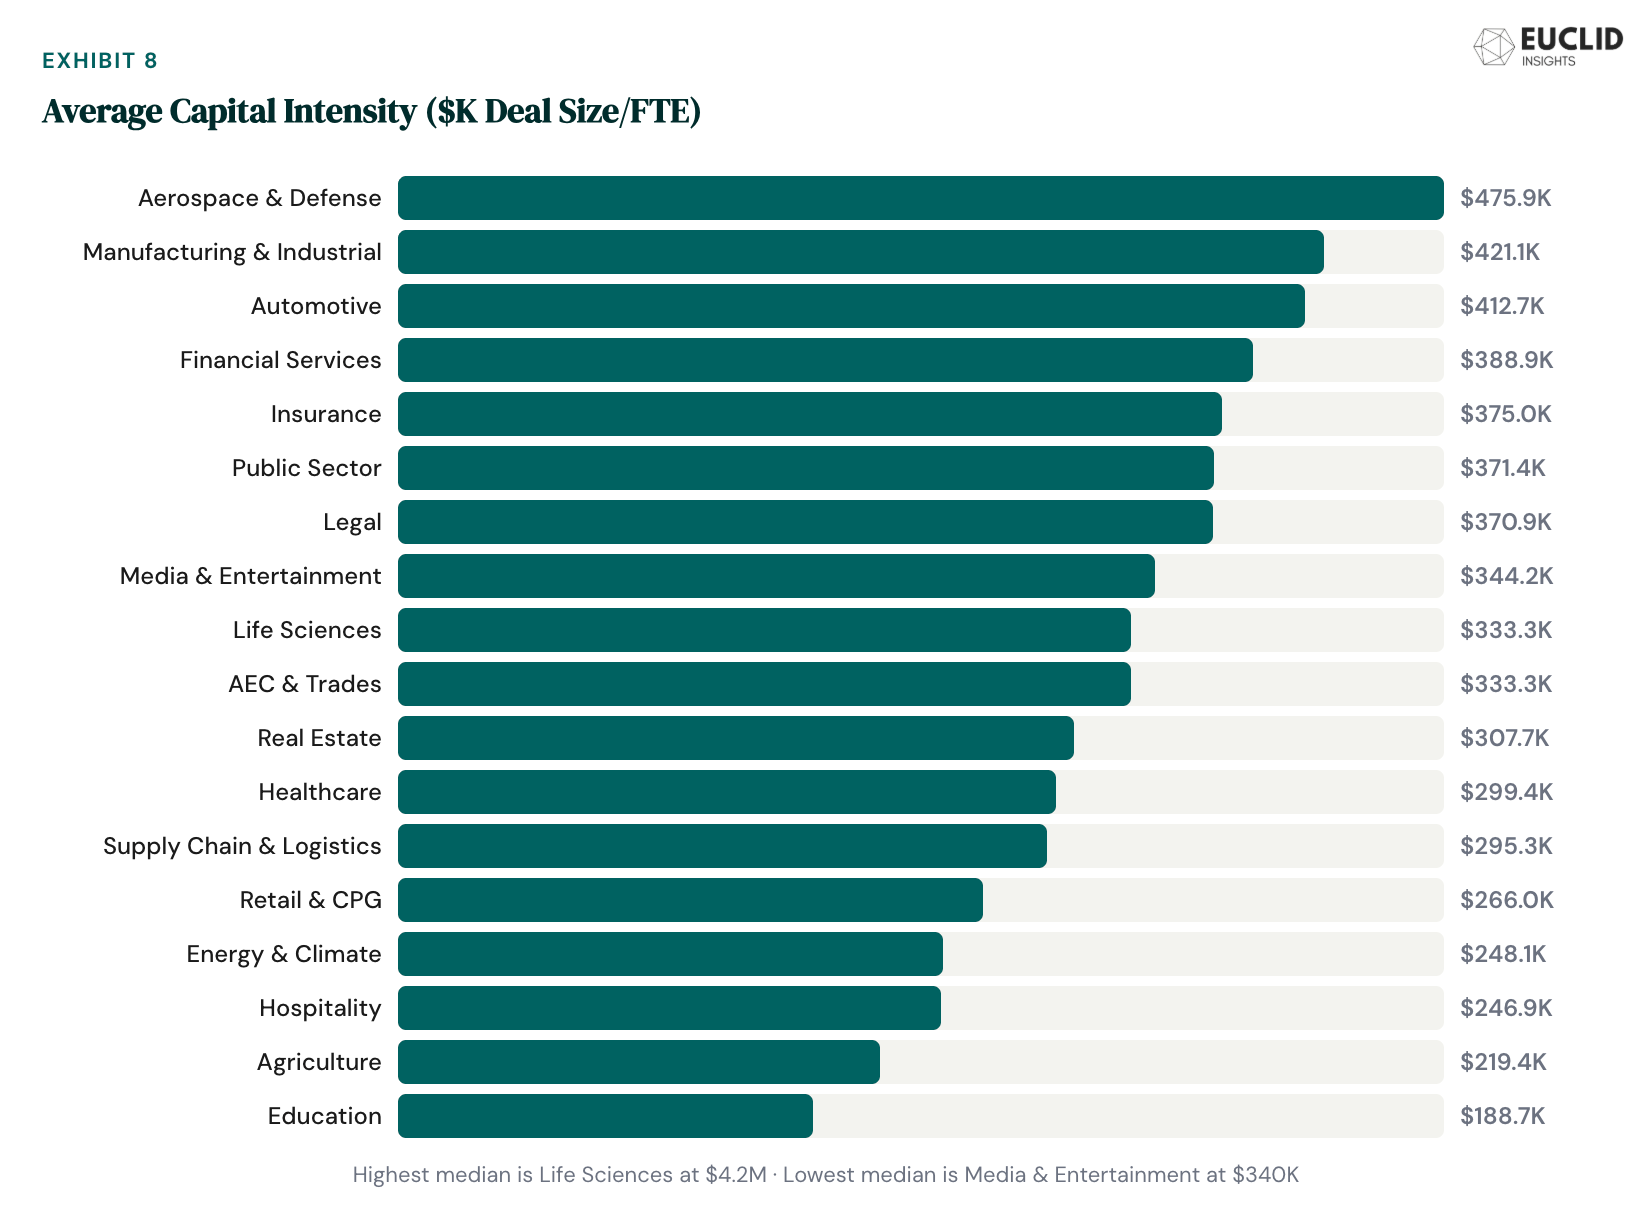
Aerospace & Defense led all verticals in both capital intensity per employee ($476K per FTE) and median valuation step-up (2.15x). It beat Manufacturing ($421K, 2.08x), which got most of the headlines thanks to Project Prometheus ($6.2B) on the funding side and Ansys ($35B) on the exit side. It beat Financial Services, which despite attracting the most aggregate capital posted a modest 1.80x step-up (turns out bigger rounds dilute per-round markups even when total value creation is strong).
The contrast with Education is particularly stark. Education had the lowest capital intensity ($200K per FTE), the lowest capital velocity ($1.6M raised per year since founding), and the lowest capital efficiency ($342K raised per employee)—bottom of the table on every capital metric. And yet Education posted the highest early-stage step-up (2.5x in the $5–15M tier). Despite great emerging stories in SchoolAI and MagicSchool, the category isn’t yet a proven absorber of capital at scale. A&D is the opposite: capital-hungry and valuation-rich, despite its unproven track record as a generator of historical VC liquidity.
Forterra’s $238M Series C—profiled in our full report—is a case in point. Unlike some other A&D high-flyers, they have production contracts and program-of-record revenue, not R&D grants. Backed by an interesting investor syndicate (Salesforce Ventures, Franklin Templeton, Hanwha, NightDragon) that reflects the reanimation of crossover investing. Beyond any one deal—and equally relevant to VC and LP funding—the intersection of government and technology a is dynamic we’re watching closely heading into 2026.
3. CA: America’s Least & Most Vertical State
Amongst all US states in 2025, California posted the lowest ratio of vertical deals, 41% — yet it was also home to the highest absolute number, at 667 deals.
This makes CA simultaneously the least and most vertically oriented in the country. Non-coastal standouts—Arizona (71%), Ohio (70%), and Tennessee (67%)—posted vertical shares that make California look like it’s playing a different game. While New York, at 53%, tracked near the national mean in terms of verticality, it was the clear #2—home to 406 vertical deals in 2025, with signs of the most momentum.
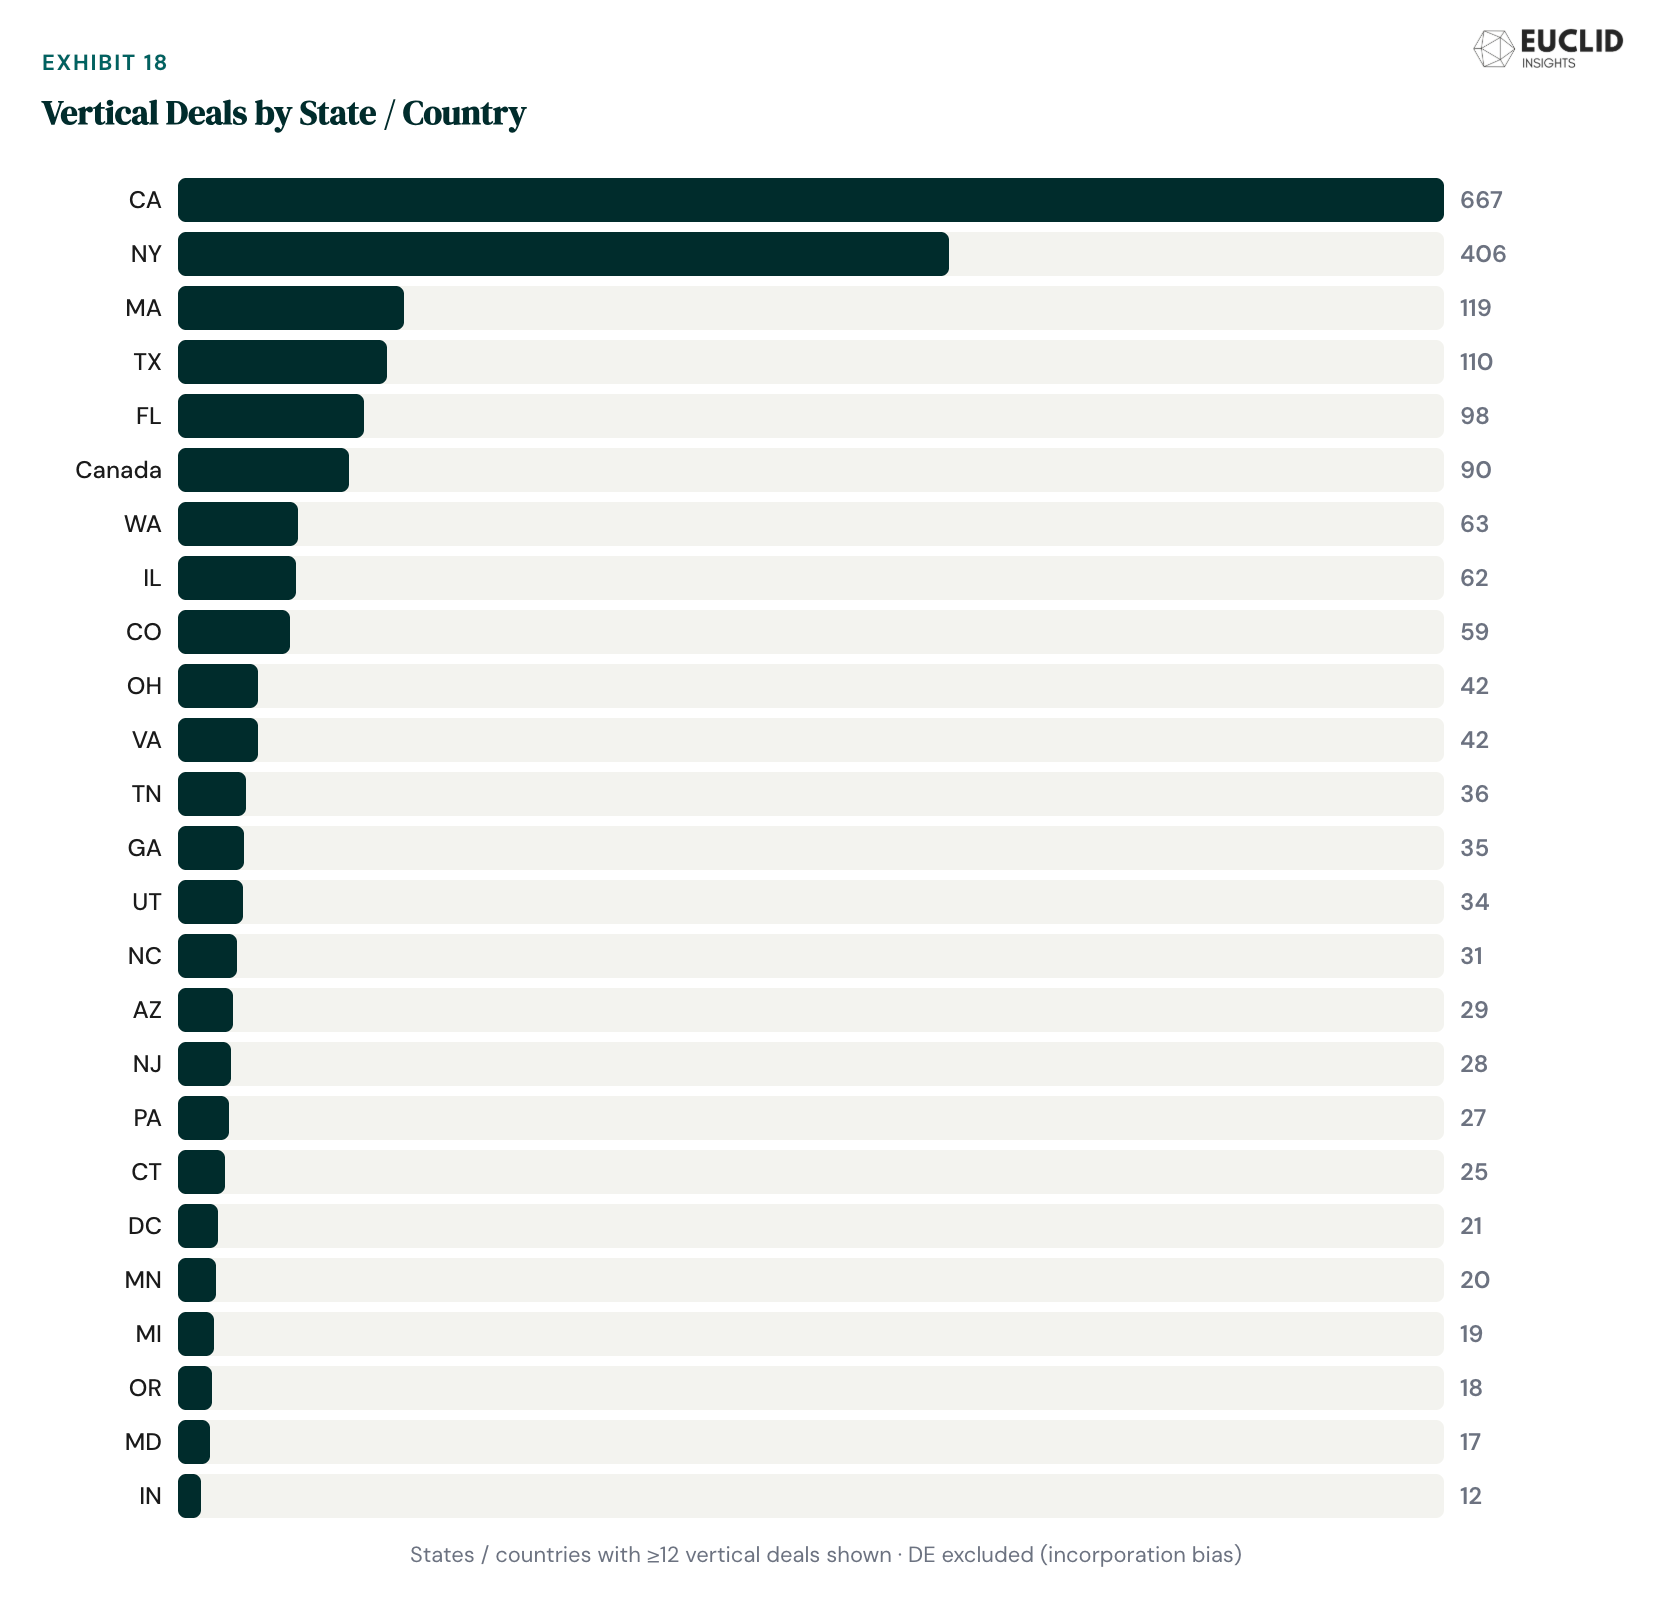
The explanation, in CA’s case, is straightforward: dominant concentration of capital-hungry horizontal AI infrastructure, foundation models, and dev tooling pulls the denominator up. And while it makes sense that company formation is strongest in industry-proximate geographies—contractors in Arizona, manufacturers are in Ohio, healthcare operators in Tennessee.
The regional data adds another layer. The Midwest leads in vertical proclivity at 59.6%, followed by a tight cluster in the mid-fifties: Mid-Atlantic, Mountain West, and Southeast. The West trails at 41.3%. And Canada’s lower vertical share—somewhat surprising given Toronto’s legacy as home of Constellation Software—appears driven by concentration in a single metro, with much of its vertical reach involving investment in US-based companies.
San Francisco and New York remain the twin dominant vertical hubs by volume and deal quality. And while the data show that non-coastal metros embrace verticality, they have two big hills to climb: (1) bridge the massive gulf of general startup gravity; and (2) keeping pace on AI-nativity in this dynamic new environment.
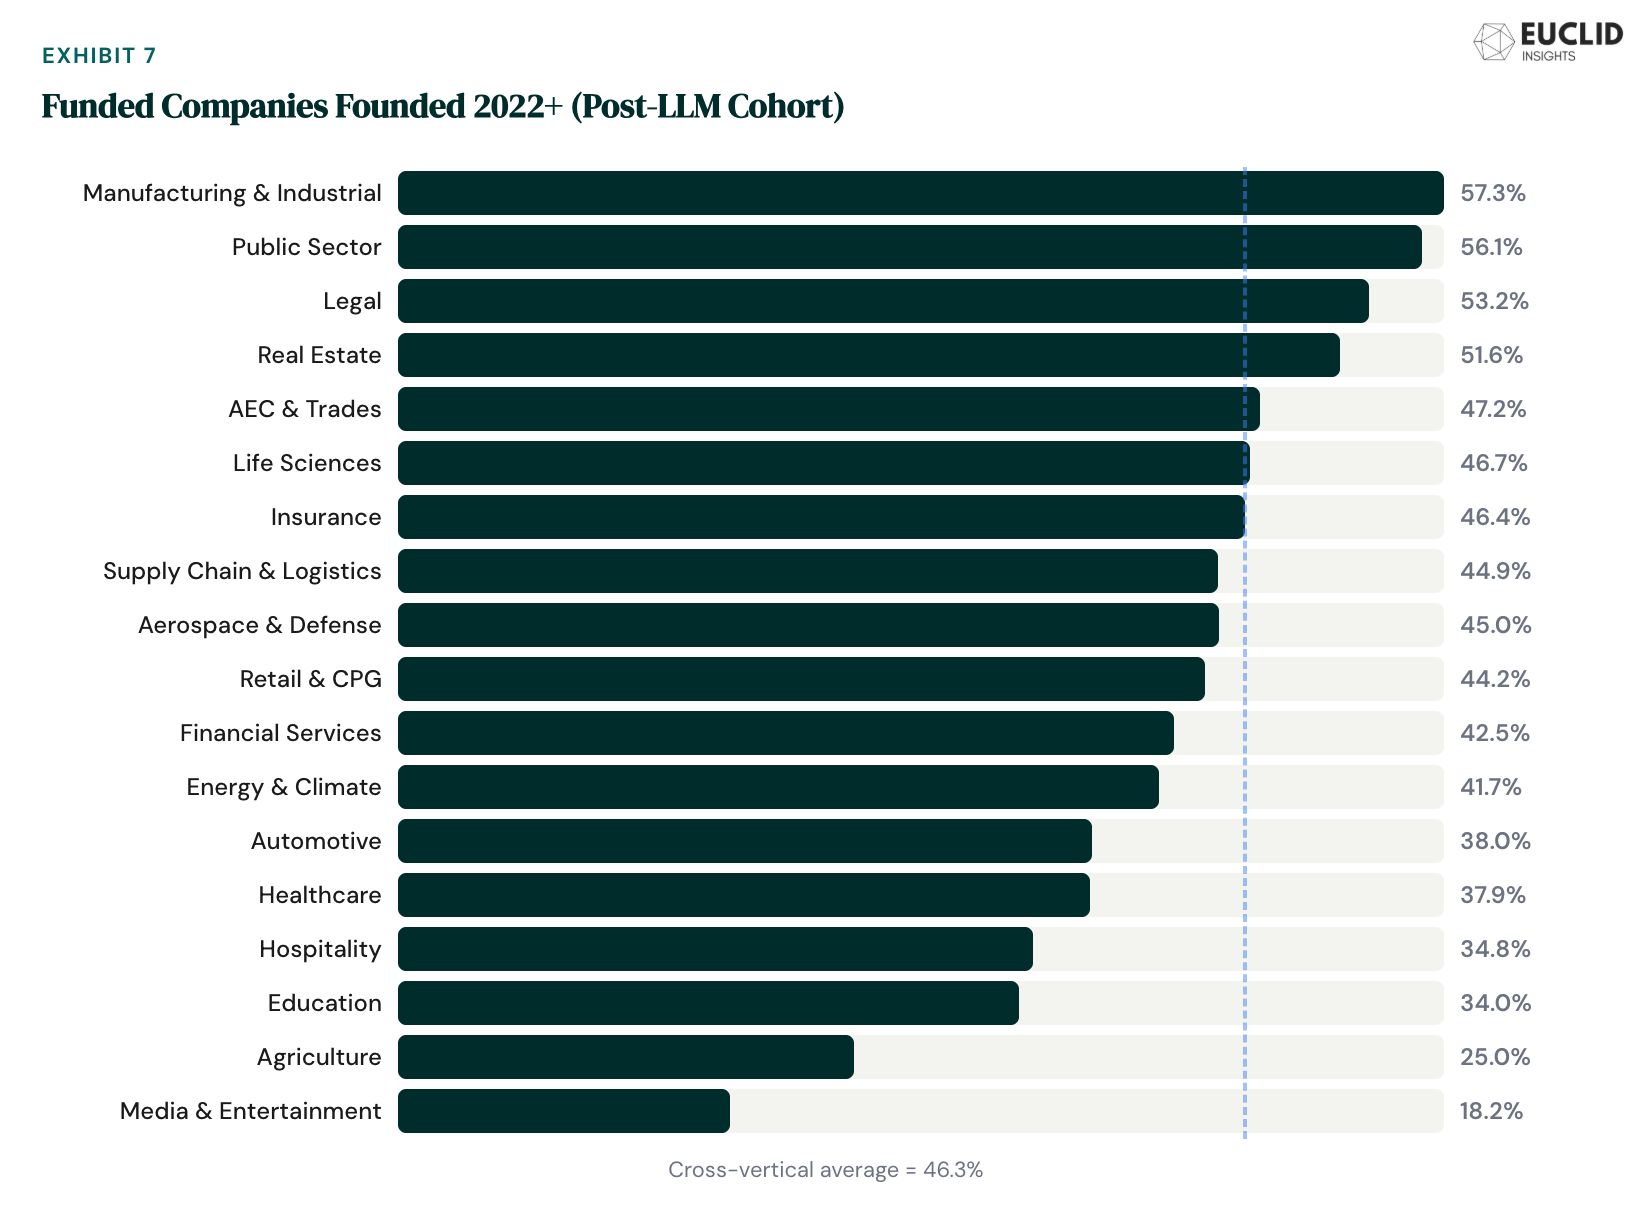
4. Manufacturing is the Momentum Leader
We examined the share of 2025-funded companies in each vertical that were founded in 2022 or later—the post-LLM cohort. Manufacturing & Industrial led in “AI-native” share at 57%. Not healthcare. Not legal. Manufacturing.
More than half of all manufacturing AI companies funded last year didn’t exist before ChatGPT. The cross-vertical baseline is 46%, meaning manufacturing’s new-company share runs 11 points above average. Public Sector (56%) and Legal (53%) also exceeded the mean, but manufacturing’s lead reframes the narrative around the dominance of white-collar verticals in AI-native opportunity.
Deal activity data supports the formation data. Manufacturing deal count rose 41% from Q1 to Q4, the steepest acceleration of any vertical. The category produced the year’s second-largest financing—a $6.2B round we profile among the full report’s fifteen deal highlights.
At the same time, it’s important to remember that as AI and robotics merge into “Physical AI,” core differences in business model can be blurred. Much of this activity in Manufacturing — at least from a capital standpoint — is going into hardware-dominant, high marginal-cost businesses. At $421K in capital intensity per employee, Manufacturing & Industrials companies are raising more to meet the physical-world infrastructure requirements of bringing AI to factory floors, supply chains, and industrial operations — and they are spending more too.
5. Liquidity, Liquidity, Liquidity
In 2025, buyout and LBO transactions accounted for 20% of vertical exits by count—but generated about as much liquidity as M&A. PE firms view vertical software as ideal acquisition targets: recurring revenue, defensible market positions, and operational leverage from AI integration. The majority of PE-backed software acquisitions in 2025 targeted vertical companies. Silver Lake, EQT, and TPG were among the most active acquirers.
Meanwhile, IPO activity last year was meager — but perhaps a start. 2025 produced 9 vertical IPOs (of 15 total) generating $4.3B in aggregate value (just under 40% of all IPO value). Something after a two-year drought, but thin relative to the backlog of late-stage companies that raised $200M+ rounds over the last 12-24 months. Expect more tough go/no-go listing decisions in 2026–2027.
The most revealing exit metric may be the simplest one: the median vertical exit in 2025 was approximately $500M. For the many seed and Series A funds that have scaled up AUM since 2021, driving superlative returns via such median outcomes demands discipline on entry price that seems quite rare these days. At a $10-20M post-money seed, a $500M exit represents 25-50x gross valuation appreciation—exceptional. At a $50M+ post-money “seed” (increasingly common in consensus Vertical AI), the same exit is 7-8x gross. Still great, but tough math for a >$100M AUM fund.
The top 10 exits by value in 2025 accounted for over 60% of total vertical exit value—a reminder that no category escapes power-law dynamics. Below the mega-deals, PE remains a leading exit path, IPOs remain selective — the “middle market” of vertical exits ($250–1B EV) is arguably the healthiest and most under-appreciated segment of the liquidity environment, at least in VC land.
What’s in the Full Report
The findings above are drawn from roughly a quarter of the complete Vertical Report. The full publication includes:
Vertical-by-vertical analysis of 18 sectors: deal count, capital deployed, stage mix, median deal sizes, and quarterly momentum for each—from Healthcare (597 deals, $11.8B) down to Energy & Climate (60 deals, $900M).
Stage dynamics deep-dives: deal size distributions by vertical, capital intensity, valuation step-ups, capital velocity, and capital efficiency metrics.
Profiles of 15 notable deals, from a $190M public-sector round to a $6.2B industrial mega-financing—covering step-ups, investor syndicates, founder backgrounds, and what each deal reveals about its vertical.
The full exit landscape, including >150 deals worth $130B+ broken down by type, quarter, vertical, and size—plus the IPO pipeline and PE acquisition patterns.
Investor league tables, from the most active seed leads to the dominant growth-stage firms—plus corporate venture and SWF trends.
Complete geographic analysis by state and region.
Our 2026 outlook on four structural dynamics: the seed-to-A graduation test, deep tech’s maturity cycle, shifting liquidity winds, and the coming fight for AI defensibility.
The Vertical Report is published annually by Euclid: a VC firm backing Vertical AI founders from inception. For questions, reach out to the Euclid team via LinkedIn or DM.